How do I view interactive video analytics and reports?
Short answer
Open Reporting in the left menu. Views lists each viewing session, Interactions lists each answer and click, Viewers lists each person, and Questions breaks down the answers to each question. Filter by video, group, folder, playlist or date, then open a row for the full detail.
How to do it
Copy link to How to do it- In the left menu, open Reporting and select Views.
- Set the filters: a video, a group, a folder or a playlist, and a date range.
- Open a row to see one session: how far the viewer got, what they answered and what they clicked, with the time of each action.
- Select Viewers and open a person to see every session that viewer record has, across all your videos.
- Select Questions to see how all viewers answered each question.
- Select Export CSV on any list when you need the data in a spreadsheet or another system.
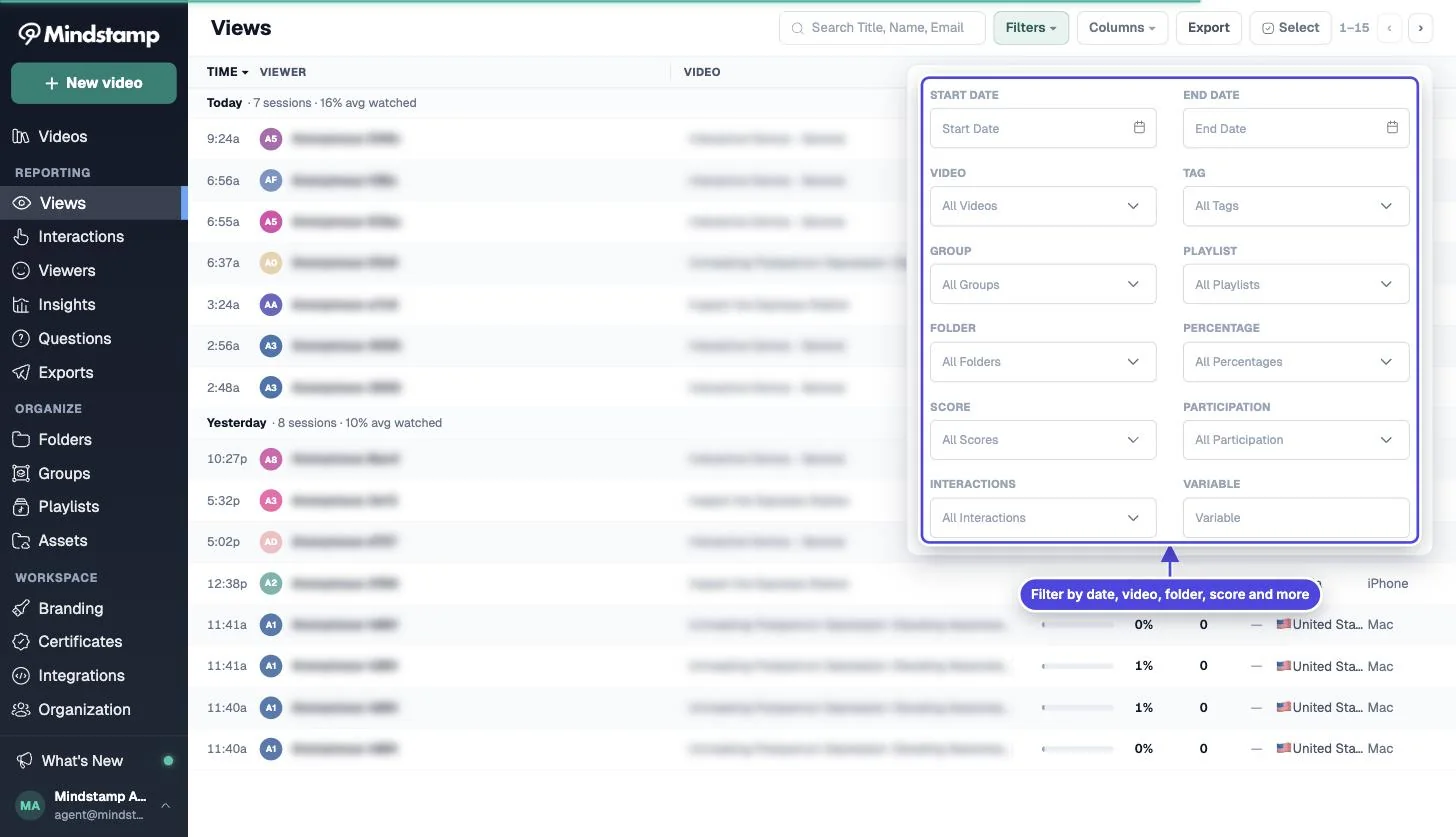
What each page shows
Copy link to What each page shows- Views: one row for each viewing session, with watched percentage, scores, device, location and the page URL.
- Interactions: one row for each answer, click or response, with the prompt and the value.
- Viewers: one row for each viewer record, with totals for views, interactions and watch time.
- Insights: totals and charts over time for the filtered videos, with top videos, top interactions, devices and countries. Its Export menu downloads daily, weekly or monthly totals as CSV.
- Questions: the answer breakdown for each question.
- Exports: the history of your one-time exports and your recurring exports.
Know what each figure measures
Copy link to Know what each figure measuresWatched percentage counts the unique seconds a viewer played, divided by the video length. A viewer who replays the same minute does not increase it. Engagement time is the time from the start of the session to its last activity, so it includes pauses and time spent on questions.
Participation is the percentage of questions the viewer answered. Correctness is the percentage of answers that were correct. These two scores answer different questions, so do not use one in place of the other. For the difference between furthest point and last point, see furthest point vs last point.
When new data appears
Copy link to When new data appearsA session becomes a finished view when the viewer reaches the end, closes the page, or stops for about two minutes. Totals, exports and integrations use finished views, so a test view can take a few minutes to show everywhere.
Playback in the editor preview is not recorded as a viewer session. To test reporting, open the share link in a private browser window.
Plan notes
Copy link to Plan notesThe reporting dashboard is on every plan. Advanced reporting for drop-off and geography is on Core and higher plans.
Know who you are looking at
Copy link to Know who you are looking atViewers are anonymous until you collect or pass their identity. Use lead capture, a personalized link or URL parameters when you need person-level reports. See viewer identity.